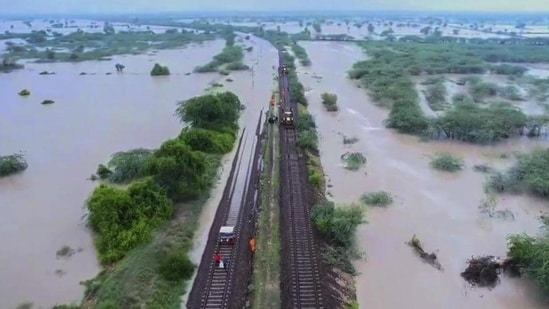
Weather Bee | Rainfall in 2024: The twin threat of floods and droughts
HT’s analysis of global rainfall data shows a dramatic increase in both flooding potential and drought-affected regions in 2024.
Floods have been reported from all inhabited continents (Antarctica is mostly visited by scientists for only a part of the year) this year. In itself, this is not very surprising because continents are very big and a small part of them getting flooded would not be strange. However, the regularity with which floods have been reported this year merits some analysis of the disasters. A roundabout analysis by HT using a global monthly rain dataset suggests that rain had the potential to cause disasters at least up to August, the latest month for which the data is available. The analysis shows that record-high January-August rain has covered the biggest proportion of the earth’s land area this year since 1979, the earliest available data. The analysis also shows record-low January-August rain covering a large area, which is in line with reports of droughts from South America and Africa.

Before analysing rain, however, it is important to understand the limitations of the data. HT analysed global precipitation instead of floods because the latter is harder to track. Data from individual rainfall stations can be averaged using mathematical techniques to get the spatial distribution of rain. This works because there is some spatial relation in rain. For example, one would be hard-pressed to find instances where a city was very wet in a month while its outskirts received no rain at all. On the other hand, cities are more likely to get flooded than their outskirts, because the former is often more concretised and has less natural drainage than the latter. The higher spatial discontinuity in floods than rain means that stations for tracking floods will need to be denser than rain gauge networks. Scientists have tried to overcome this problem using satellite images, but that may not always be useful for a time series analysis.
To be sure, precipitation data also has some problems. For example, the spatial relation in rain does not always extend very far, especially in hilly areas, where the terrain itself plays a role in rainfall. Therefore, rain at places with a sparse coverage of stations is poorly described. Similarly, stations that do not collect rain data in small time intervals may not be able to track the rising intensity of rain. Since the extent of these problems varies across countries, constructing a homogeneous global rain dataset is difficult. Scientists have partly addressed this problem using data from multiple satellites (a single satellite usually flies over a region only twice a day) to fill gaps in data from stations and vice versa. HT used one such dataset – Global Precipitation Climatology Project (GPCP) Monthly Analysis Product – for this analysis.
The GPCP data gives monthly rain since January 1979 for areas bound by two latitudes and longitudes 2.5 degrees apart. This shows that the January-August rain is ranked among the top five years this year since 1979 for 17% of the land area of the earth; among the top three for 11.3% of the land area; and the highest since 1979 for 6% of the land area. Is this extent of very wet areas unusual? It is for the period since 1979. The area that was the rainiest since 1979 in the January-August period was the highest this year. The area that has received rain ranked in the top three or five is also the highest since 1979 this year.

The above statistics highlight that 2024 rain has had the potential to cause floods over a larger area than ever before since floods largely take place over land and a large amount of rain can flood even well-drained areas. They, however, do not necessarily imply that rain in some other year did not have a similar potential. It is possible that monthly rain was less in a year when intense rain covered a larger area than in 2024. Similarly, it is possible that some of the regions where rain is ranked very high are yet to arrive at their main rainy season when a high rank will be accompanied by high rainfall in absolute terms.

The analysis also suggests the possibility of another kind of disaster being more widespread this year: droughts. The January-August rain is ranked among the bottom five since 1979 this year in 13.5% of the land area; among the bottom three in 9.6% of the land area; and the lowest in 4.8% of the land area. The area of regions where rain is ranked in the bottom five is ranked ninth highest. This rank is fifth highest and second highest for the area where rain this year is among the bottom three and lowest ever. As the accompanying map shows, such low rain area was concentrated in South America and Africa, in line with reports of droughts in Brazil and Zimbabwe, for example.

The low rain trends also need to be read with the fact that GPCP’s monthly data is not useful for tracking intensity. A region with a low accumulation of rain over eight months can also suffer floods on a particular day. Nonetheless, this analysis highlights that the rain this year is unusual over a very large area. If the area that has received its highest and lowest ever January-August rain since 1979 is added up, the combined area of the extremes is also ranked the highest since 1979. This suggests that rain trends have had the potential to cause disasters over a large area this year, possibly the largest area in four and half decades.
Abhishek Jha, HT’s assistant editor-data, analyses one big weather trend in the context of the ongoing climate crisis every week, using weather data from ground and satellite observations spanning decades.
Continue reading with HT Premium Subscription


