Weather Bee | Does the 2024 monsoon have more rainy days than usual?
How does the 2024 monsoon fare in terms of the number of days it has rained? Here are three charts that try to answer this question.
The 2024 monsoon season — it runs from June to September officially — is one of the wettest in India’s recorded history. The rainfall for the June 1-August 20 period is ranked 22nd highest this year since 1901, according to the gridded data of the India Meteorological Department (IMD). However, overall rainfall can be high even with a few days of rain if the rain is intense. How does the 2024 monsoon fare in terms of the number of days it has rained? Here are three charts that try to answer this question.

Unlike the amount of rainfall, calculating the number of rainy days is almost always meaningless for a large area. This is because even if a small portion of a big region receives rain, the average for the region overall will show the day as a rainy one. For example, India had a rainy day on all but 224 days out of the total 45,158 days from January 1, 1901, to August 20, 2024. Moreover, none of these 224 dry days so far have been in the June-September monsoon period.
The trend discussed above makes it clear that there is little point in counting the number of rainy days in the monsoon season at the country level. However, one can do this at the level of the grids, the smallest unit of IMD’s gridded data. In IMD’s gridded data for rainfall, a grid is a box bound by two latitudes and longitudes 0.25 degrees apart, which is roughly a distance of 25 kilometres.
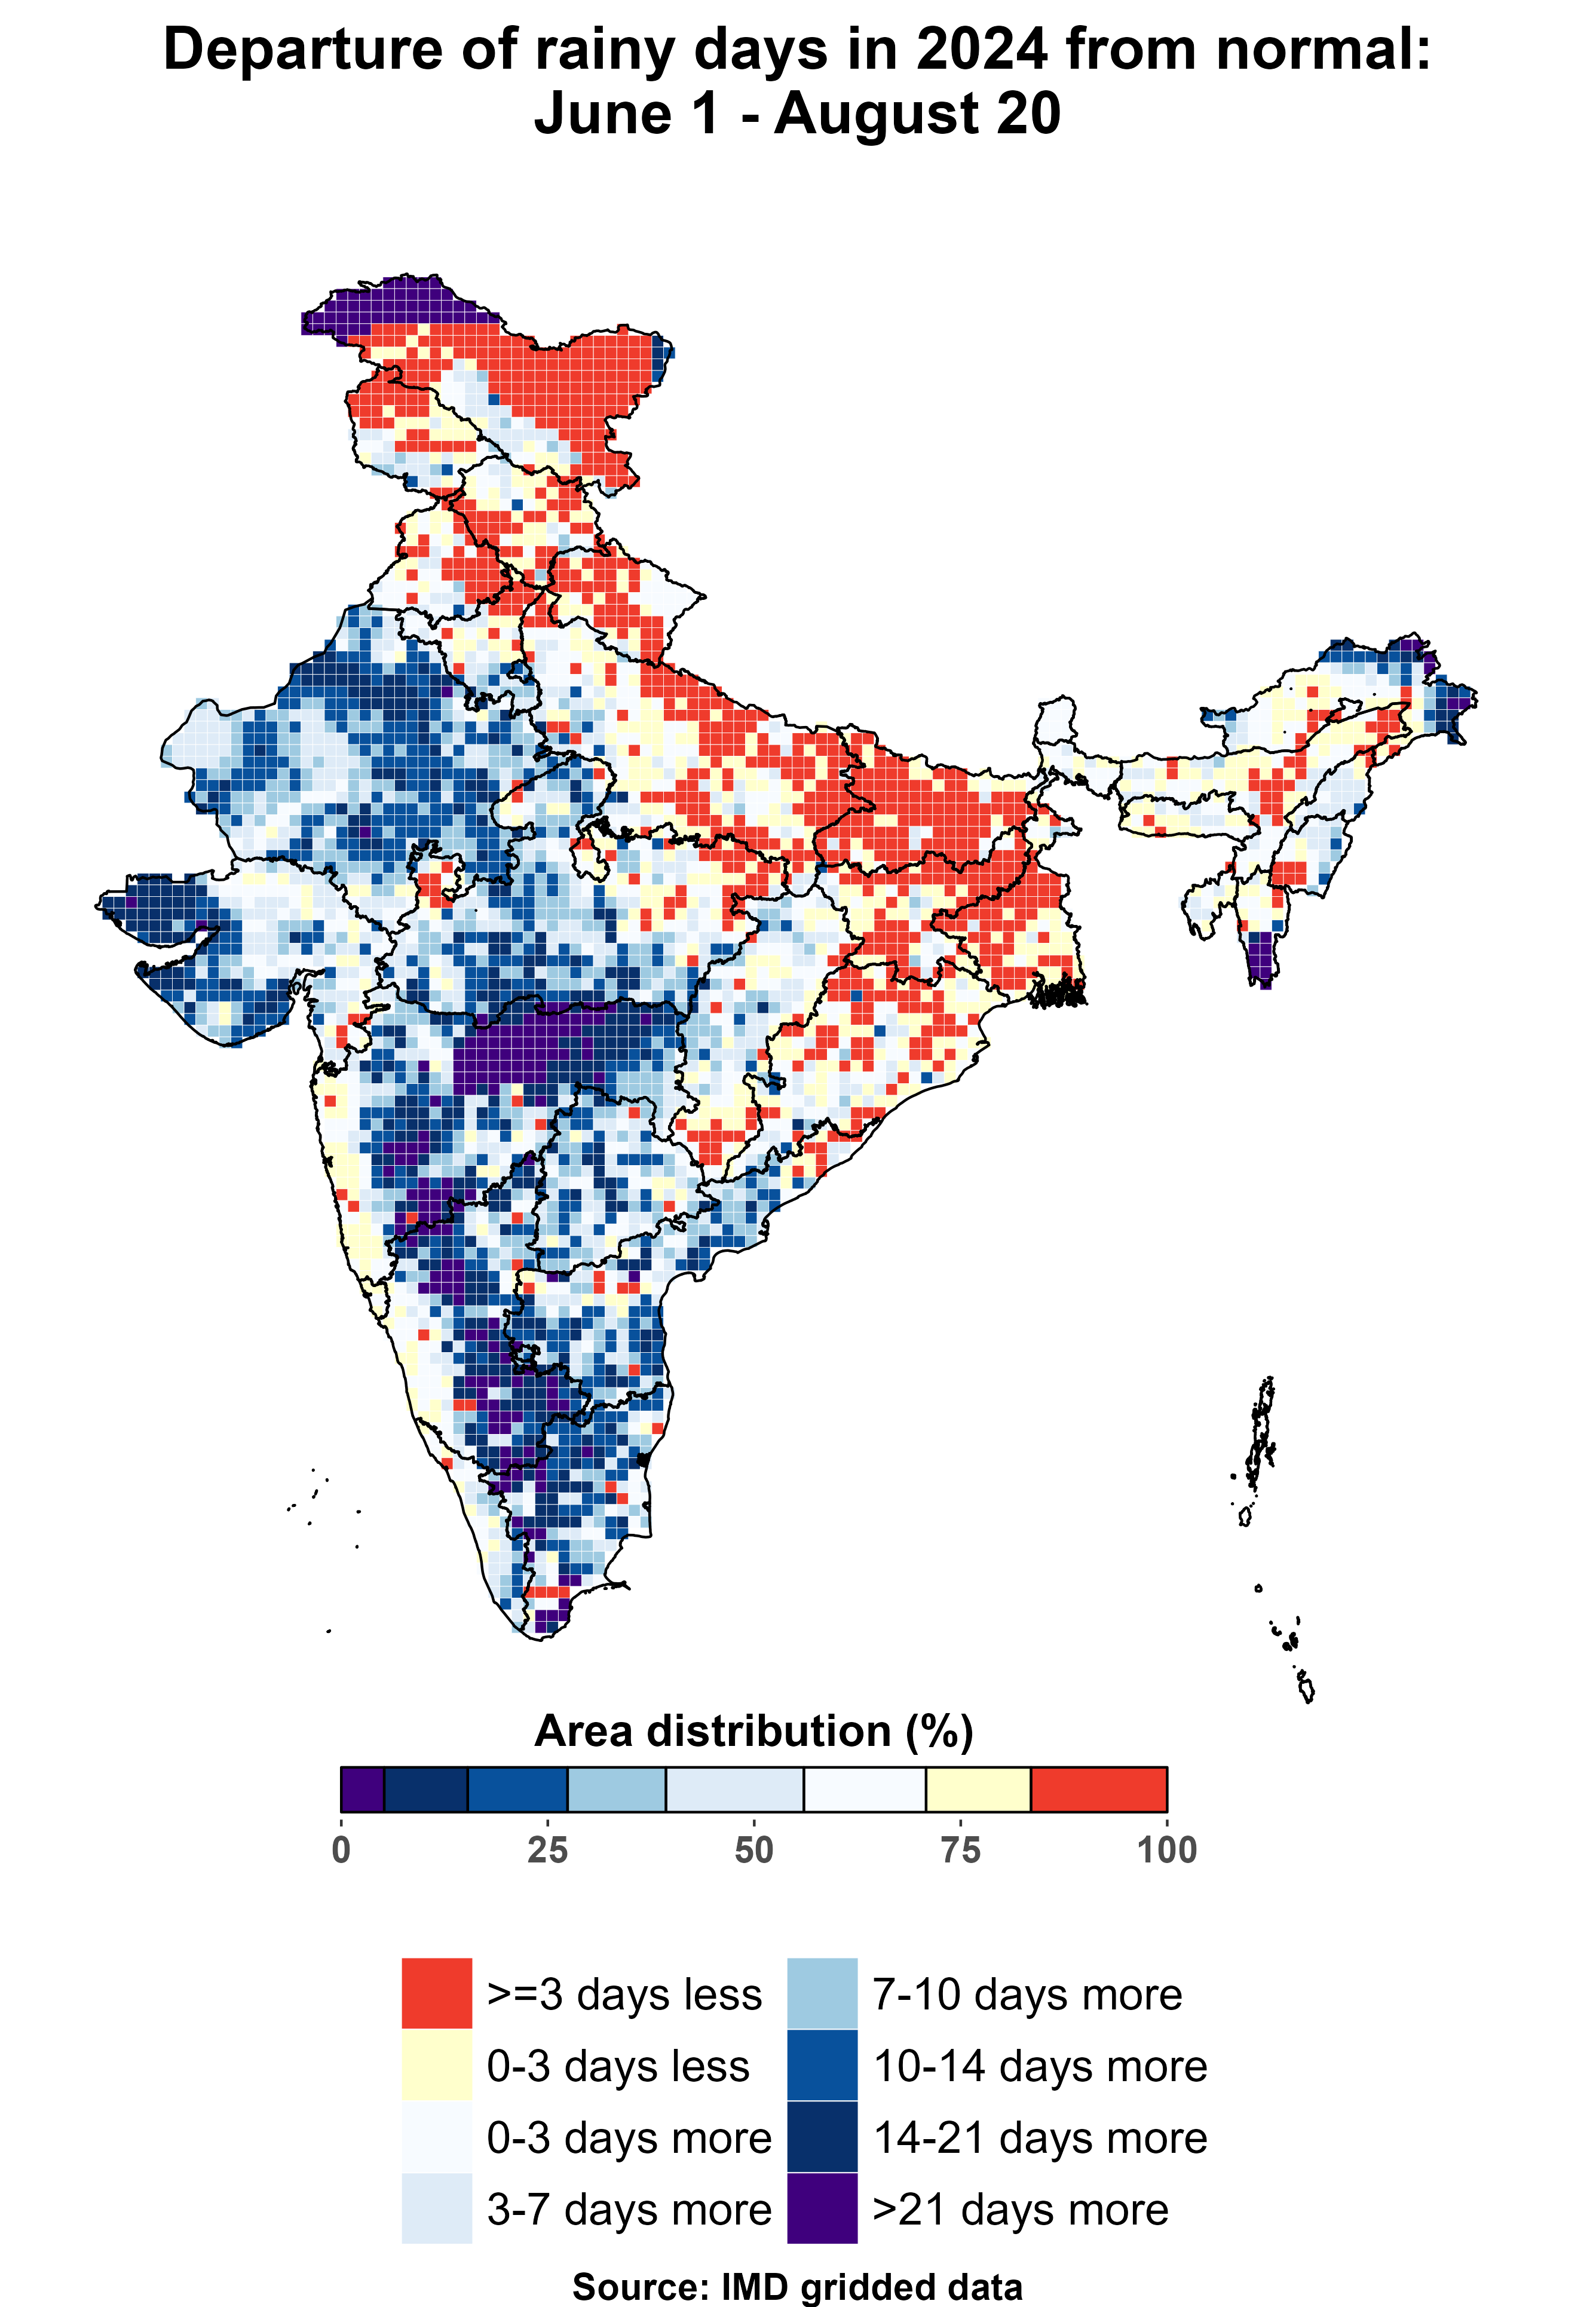
Analysing the number of rainy days in each grid shows that 83% of India has received rain on more days this monsoon than on average during the 1971-2020 period. The 1971-2020 period is currently considered the Long Period Average (LPA) by the IMD for measuring rain’s performance.
To be sure, one or two days of extra rain would hardly be extraordinary. However, that is not the case in 2024. For more than one-third of the country (39%), the extra rainy days this monsoon compared to the LPA are more than seven. For a small area (around 5%), the number of extra rainy days are at least 21. Where have rainy days increased the most? Largely in the western and peninsular areas and parts of north-eastern India. To be sure, as the accompanying map shows, this does not include the west coast.

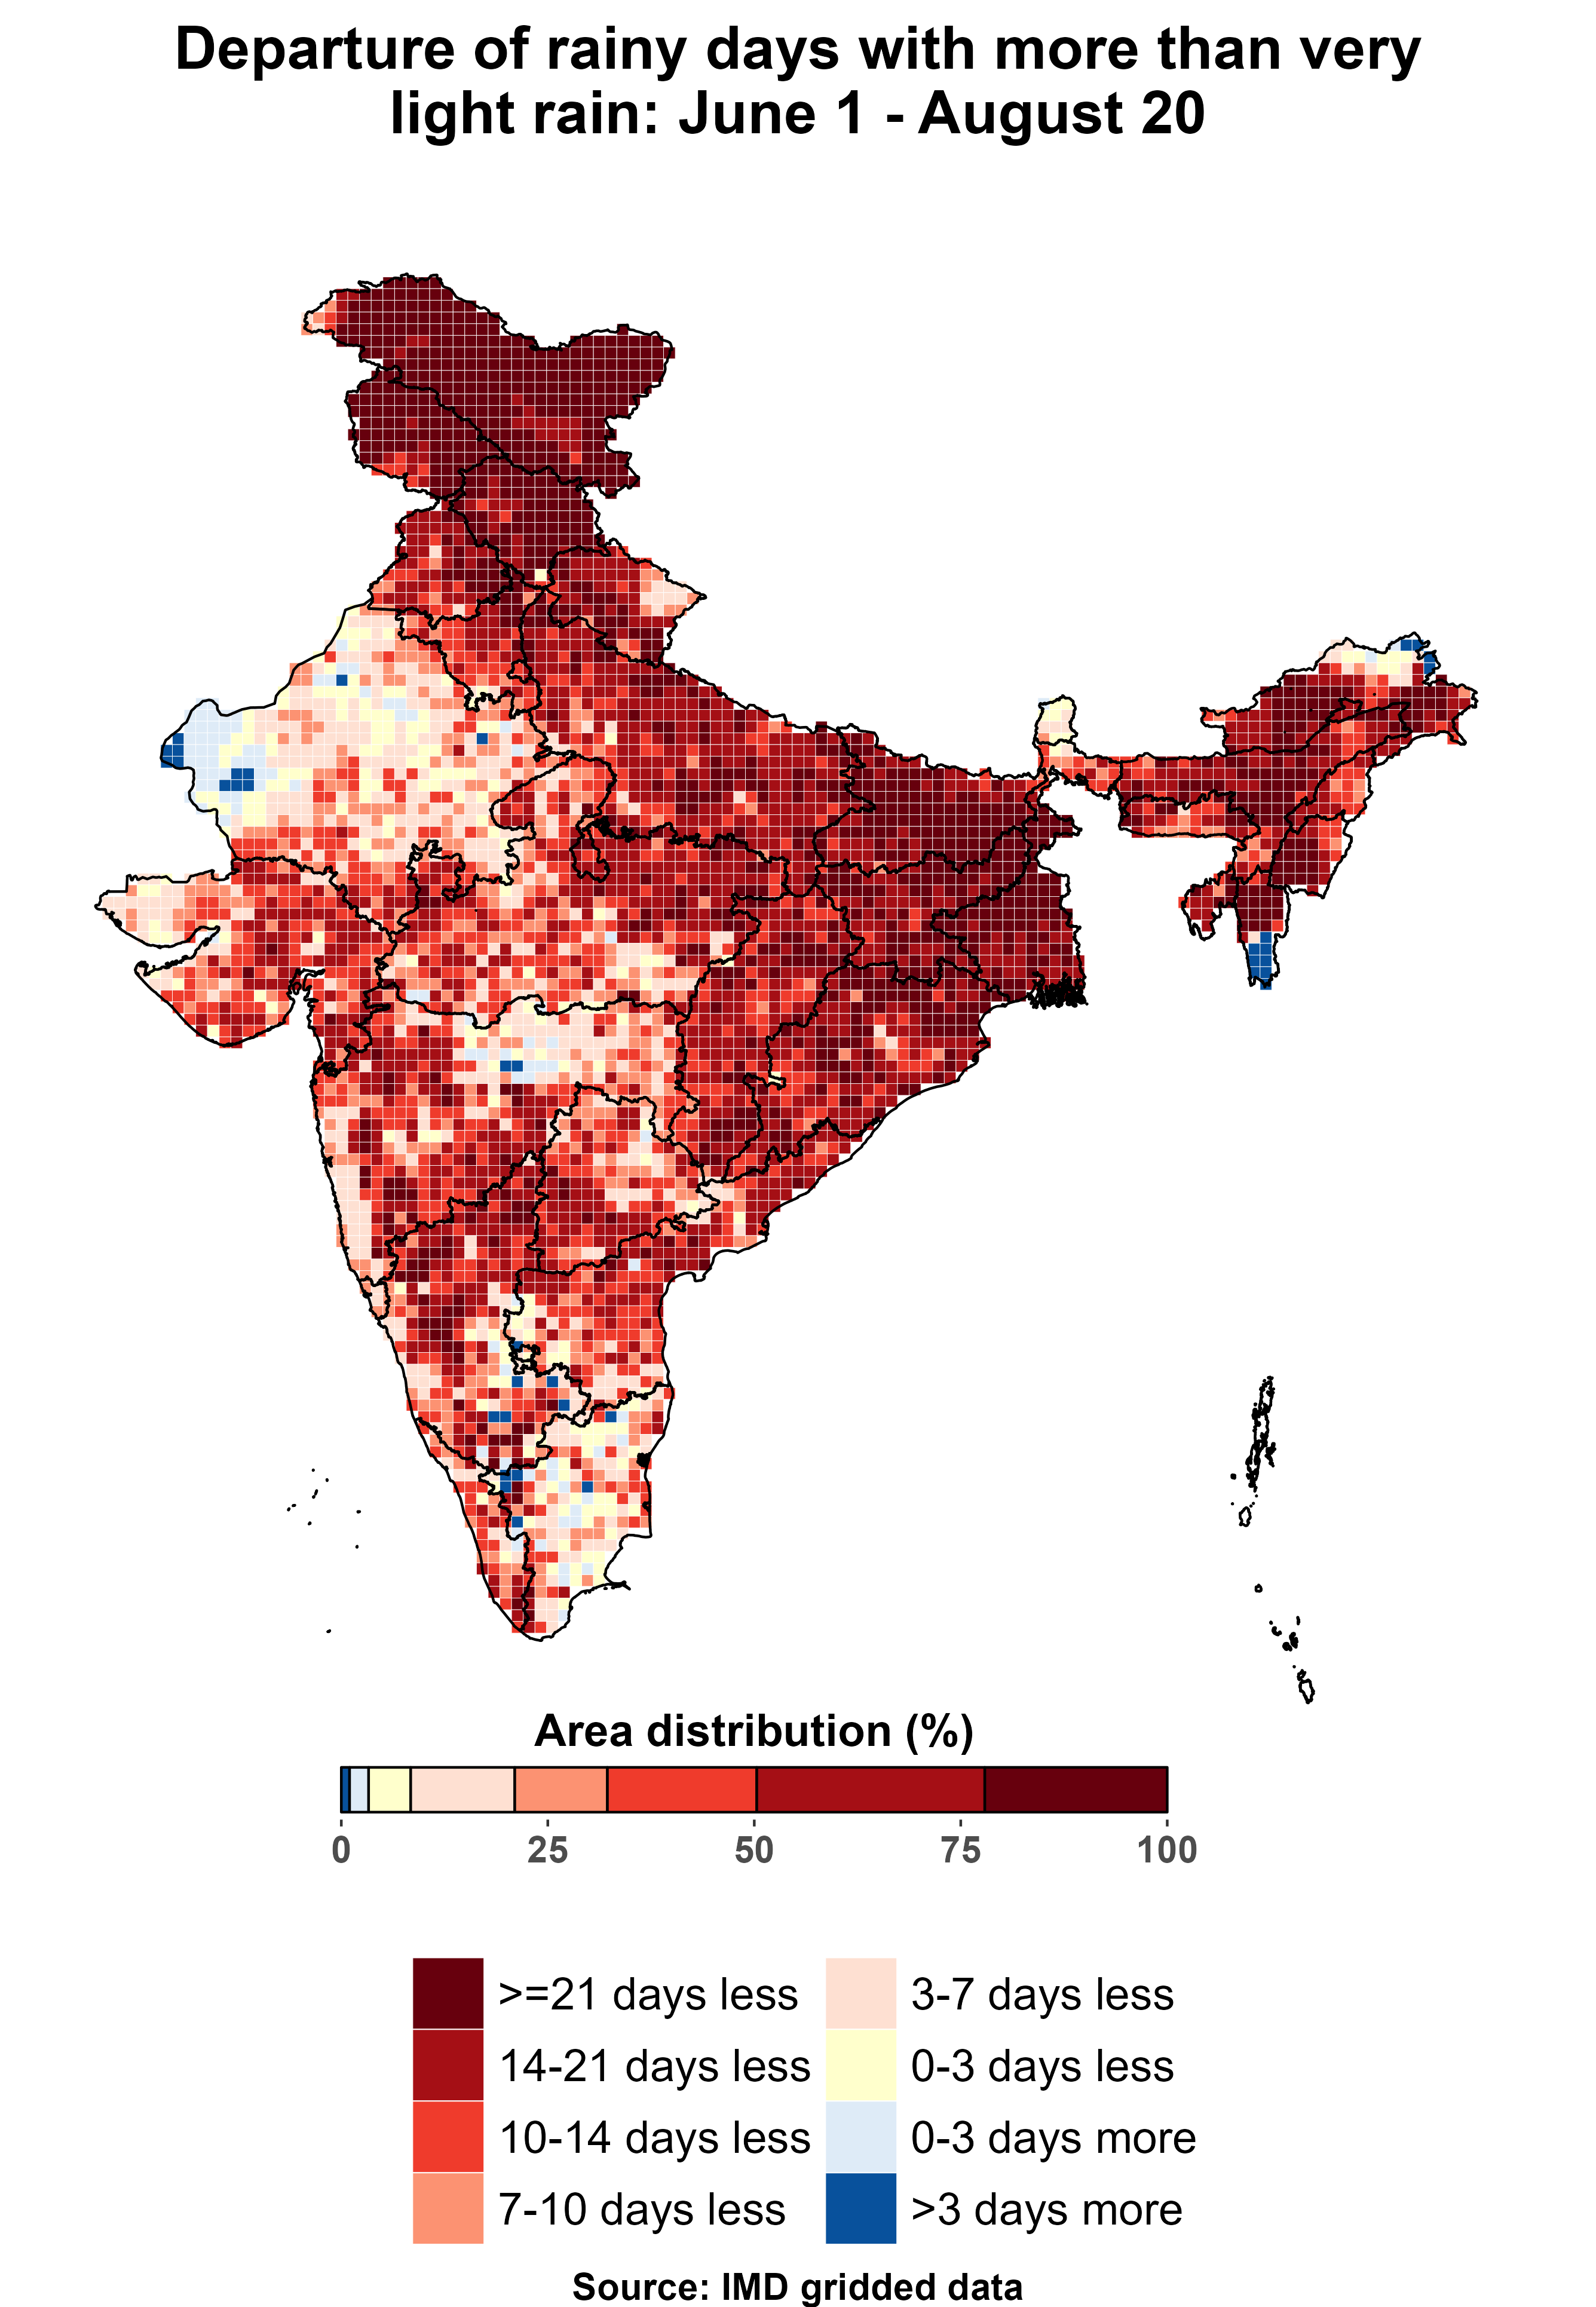
Another thing to keep in mind while reading a number of rainy days is that it can increase drastically even if the amount of rain on the extra days is hardly noticeable. For example, Delhi’s political boundaries overlap with two grids of IMD’s gridded data. The LPA of rainy days for these grids for the June 1-August 20 period is 40.6 and 38.6. In 2024, these grids have received rain on 51 and 48 days respectively, more than a week longer than the LPA. However, it rained at least 2.5 mm (or rain of more than “very light” intensity) on only 30 and 25 days, much less than their LPA for this kind of rain: 39.7 days and 38.2 days. This means that rainy days have increased in Delhi largely on account of very light rain.
The case with Delhi is also the case with most of the other places in the country. Rainy days of more than very light intensity have increased over just 3% of the country. Does this mean that the rains are less intense this monsoon?
This is not necessary at all. Another example can make this clear. If a place gets 2.5 mm rain on 40 days in one year, all of its 40 rainy days will be of intensity just above very light and the place will get 100 mm rain in total. This 100 mm rain can also be distributed in another way: 50 mm rain in one day 0.5 mm rain in 100 days. Clearly, this second year’s rain is more intense although it has just one day of intensity more than very light, 39 fewer than in the first year. At the same time, this second year will have 101 rainy days in total, 61 more than in the first year.

The examples given above show that there is no contradiction between rainy days increasing purely because of very light rain and rain becoming more intense. This appears to be the case this monsoon in India. The number of rainy days has increased but almost everywhere only because of very light rain. However, as the surplus in the amount of rain and the rain-related disasters suggest, the days of intense rain have been more intense than normal.
Abhishek Jha, HT’s senior data journalist, analyses one big weather trend in the context of the ongoing climate crisis every week, using weather data from ground and satellite observations spanning decades.
Continue reading with HT Premium Subscription


