Weather Bee | Breaking down the performance of rain this monsoon
Despite normal national average rainfall, India's monsoon season is marked by significant regional and temporal disparities.
Almost one-third of the official monsoon season — it runs from June to September — is now over. How is the rainfall performance in the ongoing monsoon season? The answer to this question is not straightforward, due to the effect of the climate crisis. While the national average of cumulative rain from June 1 suggests that rain this monsoon is well within the normal range, this is hardly the case when looking at rain in different parts of the season or parts of the country. Here are two charts that explain this trend.

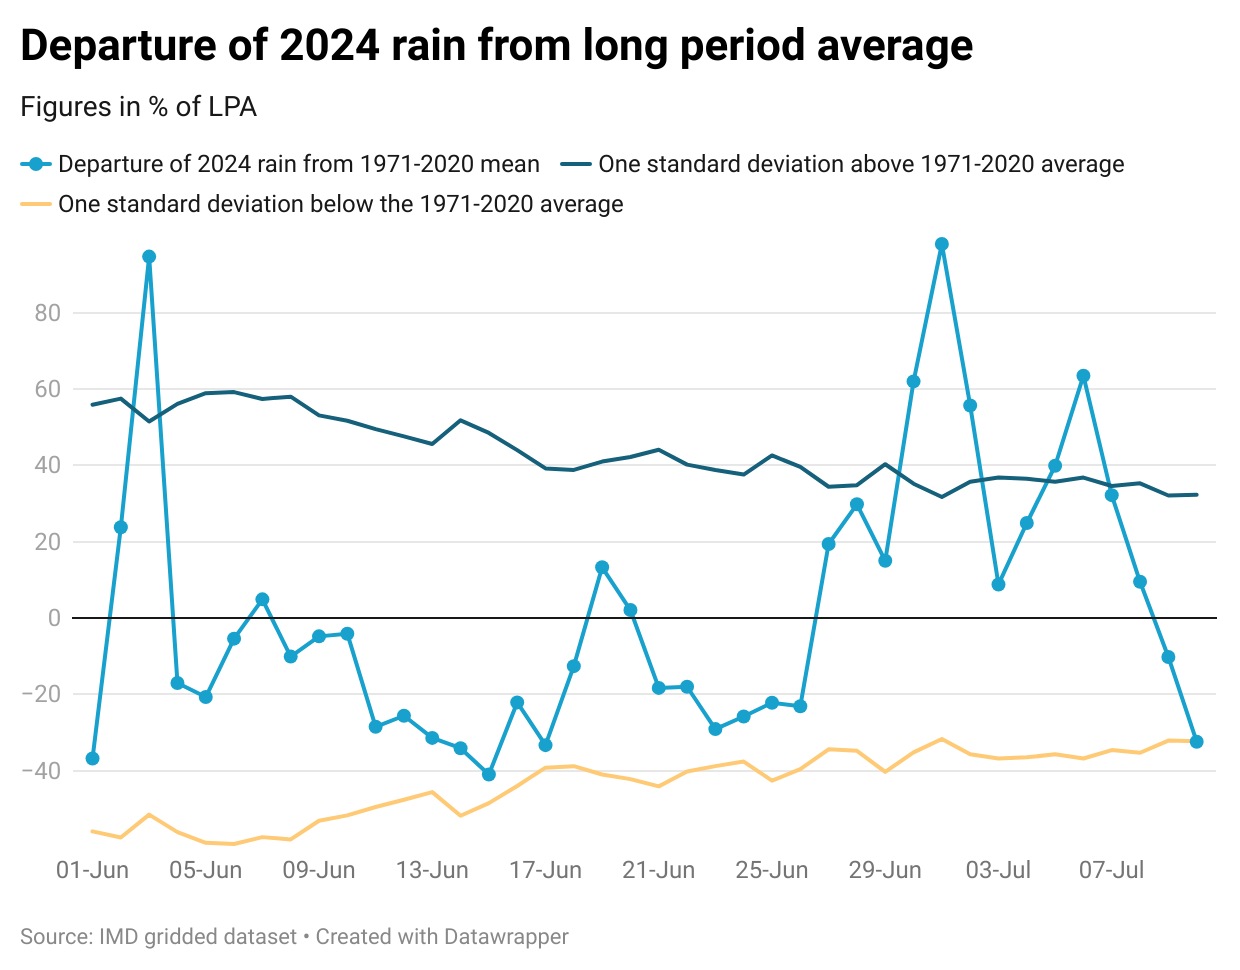
According to the India Meteorological Department (IMD’s) gridded dataset, India has received 261.8 mm of rain up to July 10 this monsoon. This is 12.2 mm or 4.9% more than the 1971-2020 average or the Long Period Average (LPA) for June 1-July 10 rain. The 1971-2020 period is currently used by the IMD to test how normal the rain in India is. If the deviation from the 1971-2020 average is within one standard deviation (this is a measure of how rain varied annually in the 1971-2020 period from the 1971-2020 mean), rain is considered normal. The 12.2 mm or 4.9% rain in 2024 in the June 1-July 10 period is well within the normal range because the standard deviation from the LPA in the 1971-2020 period was 38.7 mm or 16%.
However, even a cursory glance at news reports will show that rain this monsoon season has neither been normal on all days nor normal at all places. For example, rain in June had a 6.7% deficit, within the range of 18.6% departure from normal. However, July rain has a 27.9% surplus, above the normal range of 23.9% departure for its first ten days. Even these monthly trends have differences across their days. For example, the daily surplus was much more than the normal range on June 3 and June 30. Similarly, the overall July rain so far going above the normal range is because of five days of departures beyond the normal range.

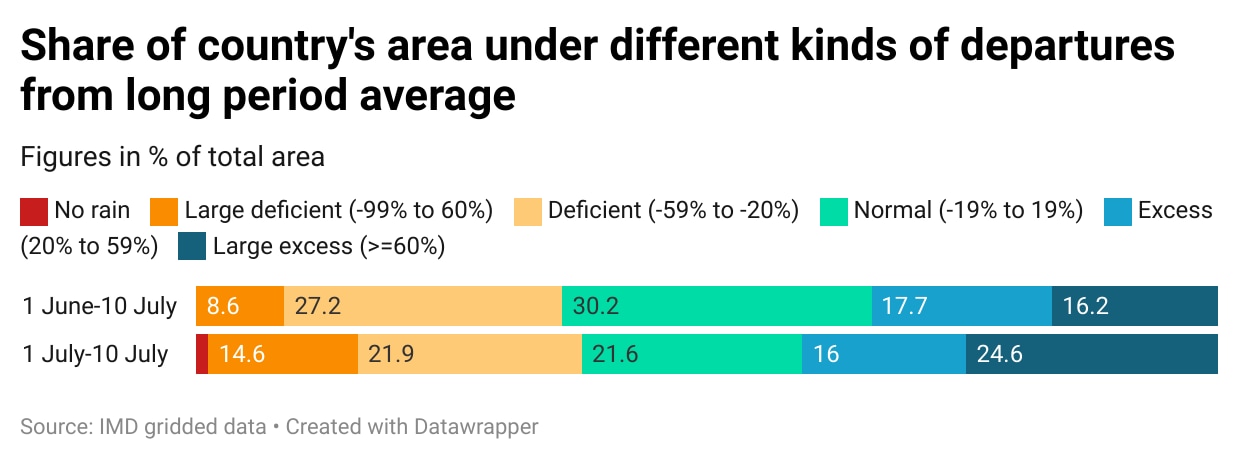
To be sure, even daily and monthly aggregates of the national average of rain paper over the wide variations locally. So far, only 30% of the country has received rain within a 20% range of the place’s LPA, considered an approximate normal range for local rain. 27% of the country is deficient (20%-60% deficit), while another 9% is large deficient (deficit of 60% or more). Similarly, 18% of the country has got excess rain (surplus of 20%-60%) and 16% of the country has received a large excess of rain (surplus of 60% or more). As expected, the area under normal rain is likely to appear smaller if the rain is disaggregated by month or day. For example, only 22% of the country has received normal rain in the first ten days of July while 38% of the country has received either deficient or large deficient rain and 41% has received excess or large excess rain.

It is because of these temporal and spatial variations that this monsoon has been marked by reports of heat waves or dry conditions as well as floods. One striking example of this is Delhi, the national Capital. After suffering through heat waves or humid days through most of June, the Safdarjung station of the city received 228 mm of rain on a single day on June 28, the highest on a June day since 1936. This led to another round of deaths due to rain after the heat had caused deaths throughout most of the month. Clearly, the national aggregate of cumulative rain is not a very meaningful number to judge the performance of the monsoon in the face of the climate crisis.
Abhishek Jha, HT’s assistant editor-data, analyses one big weather trend in the context of the ongoing climate crisis every week, using weather data from ground and satellite observations spanning decades.
Continue reading with HT Premium Subscription


